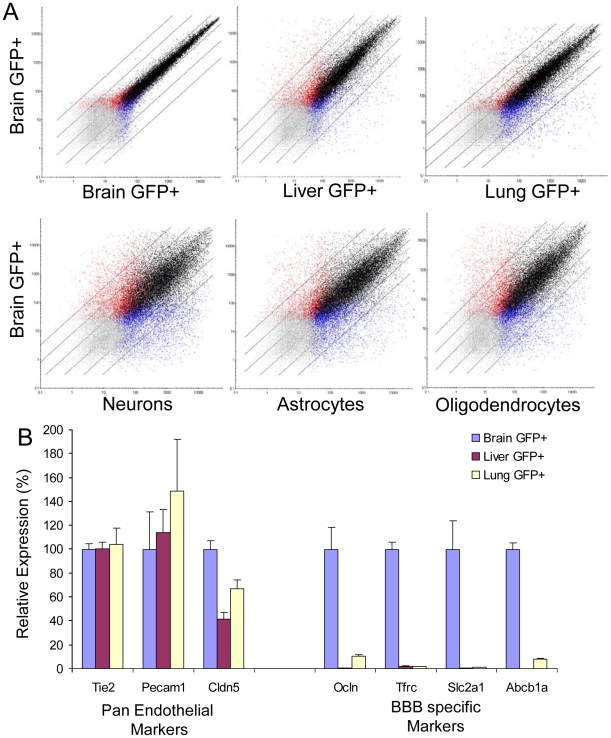
Figure 2. Comparison of transcriptional profiles of brain endothelial cells with liver and lung endothelial cells.
A) Affymetrix GeneChips were utilized to compare gene expression in GFP+ cells isolated from cerebral cortex, liver and lung of Tie2GFP transgenic mice. The data is represented as a dot plot on a logarithmic scale, where each point reflects a probe set on the GeneChip. Black dots indicate probe sets identified as present in both samples, red dots indicate probe sets identified as present in the brain but not peripheral sample, blue dots indicate probe sets present in the peripheral but not brain sample, and grey dots represent probe sets identified as absent in both samples. Two biological replicates of the brain GFP+ samples were compared to identify variation between replicates. In addition, brain GFP+ cells were compared with profiles generated for neurons and glia by Cahoy et al (2008). Black diagonal lines represent cutoffs for two-fold, four-fold and eight-fold differences. B) Validation of transcriptional profiling by comparison of GeneChip expression with known CNS endothelial markers. Expression values are given relative to the brain GFP+ sample. Pan endothelial transcripts are expressed in all GFP+ samples, whereas BBB transcripts were enriched in the Brain GFP+ sample. Error bars represent SEM.

