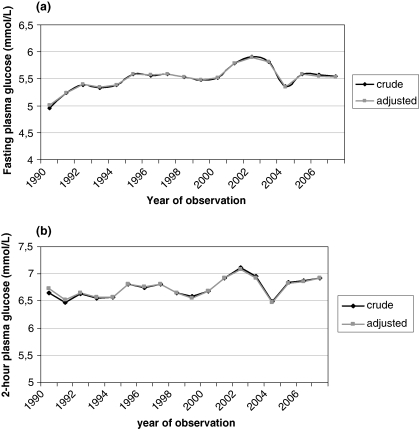
Fig. 1.
(a) Fasting plasma glucose concentration (mmol/L) between 1990 and 2007 in the Västerbotten Intervention Programme. Crude and age- and sex-adjusted mean values are presented. (b) Post-challenge 2-h plasma glucose concentration (mmol/L) between 1990 and 2007 in the Västerbotten Intervention Programme. Crude and age- and sex-adjusted mean values are presented.

