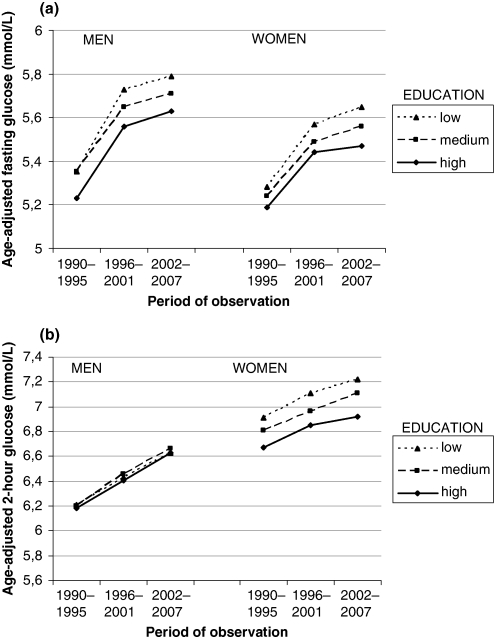
Fig. 2.
(a) Mean age-adjusted fasting plasma glucose concentrations (mmol/L) during three 6-year observational periods in the Västerbotten Intervention Programme. Data presented by educational strata. (b) Mean age-adjusted 2-h plasma glucose concentrations (mmol/L) during three 6-year observational periods in the Västerbotten Intervention Programme. Data presented by educational strata.

