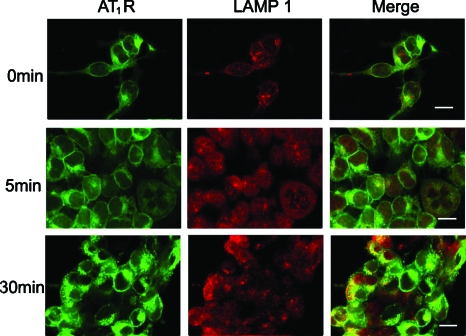
Figure 7.
Subcellular distribution of AT1R-EGFP and LAMP1-Alexa 633 in AT1R-HEK293 cells. Cells were treated with Ang II (100 nM), at the indicated time periods, as described in Section 2. Green, AT1R-EGFP; Red, LAMP1-Alexa 633; yellow, colocalization. Bar, 10 μm. (Color online only.)

