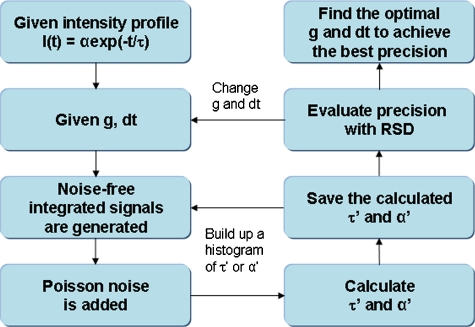
Figure 2.
MC simulation procedure for evaluating the precision of lifetime determination. The decay model I(t), gate width g, time interval dt between two consecutive gates, and the correct values of lifetime τ and pre-exponential term α were used to simulate the noise-free integrated fluorescence intensity. Then, Poisson noise was added, and the τ and α values retrieved from the noise-corrupted signals (denoted as τ′ and α′) were recorded in each iteration to build up a histogram over a number of iterations of noise addition and lifetime determination. The RSD was calculated from the histogram distribution, and this histogram buildup process was then repeated with different g and dt values. The optimal g and dt occurred when minimal RSD values were achieved. In this study, single-exponential decay was considered and RSD was evaluated only for τ.

