Figure 4.
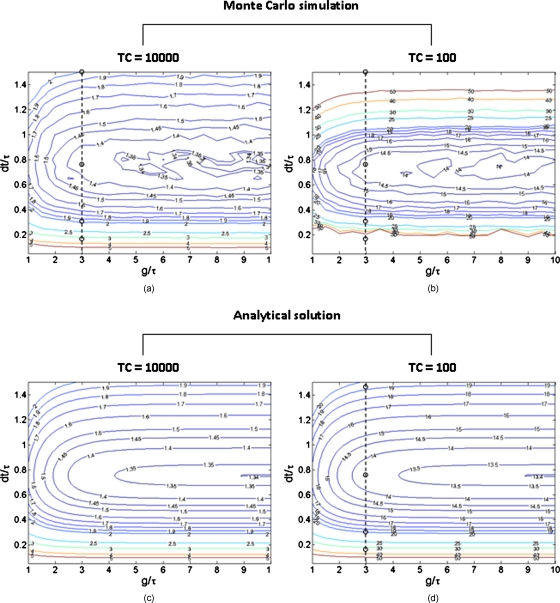
Contour plots of the relative standard deviation (RSD) of the lifetime values determined by MC simulation (Fig. 2) with (a) TC=10,000, (b) TC=100 and by analytical solution [derived from Eq. 4] with (c) TC=10,000 and (d) TC=100. dt and g were scaled by the lifetime τ. The analytical solution suggests that the RSD of lifetime is inversely proportional to (TC)1∕2, which can be observed in (c) and (d). When TC was large enough (TC=10,000), the MC simulation and analytical results were consistent. When TC was small (TC=100), higher RSD was predicted by MC simulation in the outer nonoptimal regions. The dashed lines (g∕τ=3) were further inspected with dt∕τ=0.15, 0.3, 0.75, and 1.5 (labeled with open circles) in Fig. 5 along with experimental data. Number of MC simulations=10,000. The sampling grids: For MC simulation, dt∕τ=0.05–1.5 with 0.05 increments and g∕τ=1–10 with 0.5 increments; for analytical solution dt∕τ=0.05–1.5 with 0.01 increments and g∕τ=1–10 with 0.1 increments.

