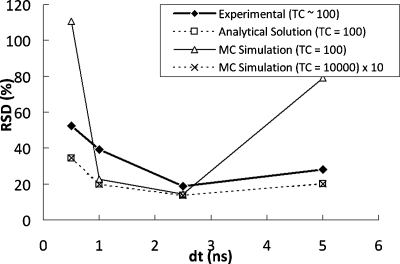
Figure 5.
Percent RSD (relative standard deviation) in calculated lifetime (dashed lines and open circles in Fig. 4) and experimentally measured lifetime, as a function of the time interval dt (in nanoseconds) between two consecutive gates. The RSD values of the measured lifetime were determined from the lifetime values retrieved from the nonzero pixels in the FLIM images of the experimentally prepared fluorescent beads. The simulation∕analytically determined value of optimal dt (2.5 ns) was verified by the experiments to produce lower lifetime RSD than the surrounding dt values. The gate width was fixed at 10 ns, and the TC were ∼100.

