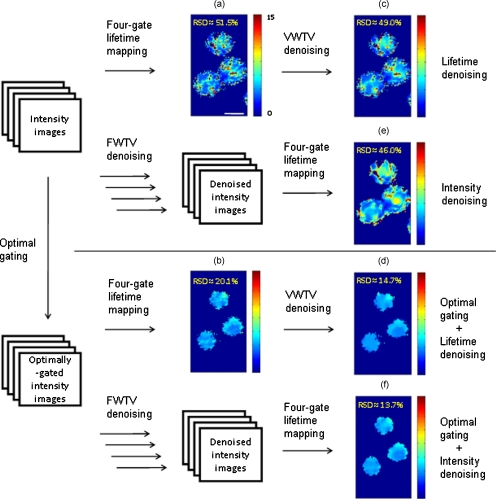
Figure 6.
FLIM images of fluorescent beads acquired with a gate width of 10 ns and different values of the time interval dt between two consecutive gates: (a) dt=0.5 ns, undenoised; (b) dt=2.5 ns (optimal), undenoised; (c) dt=0.5 ns, lifetime denoised; and (d) dt=2.5 ns (optimal), lifetime denoised; (e) dt=0.5 ns, intensity denoised; and (f) dt=2.5 ns (optimal), intensity denoised. The nonoptimally gated intensity images, optimally gated intensity images, and their corresponding FWTV-denoised images are shown in Fig. 7. The improvements in precision by optimal gating and TV denoising in combination are easily observable in this low-light case (TC=∼100). The labeled RSD values were obtained from all pixels with lifetime of >2 to remove the variations from the background values. Scale bar: 10 μm.

