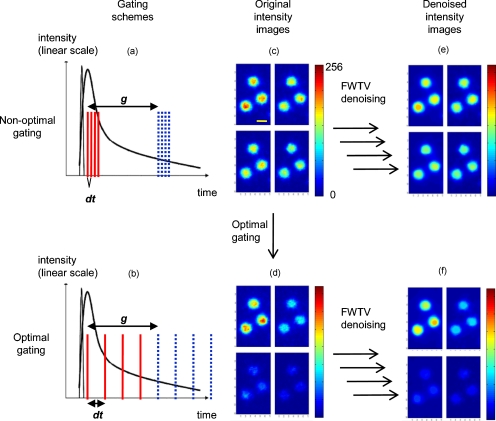
Figure 7.
The (a) nonoptimal and (b) optimal gating schemes, and (c) the nonoptimally and (d) optimally gated intensity images, and (e,f) their corresponding FWTV-denoised images, respectively, used to obtain the results shown in Fig. 6. In (a) and (b), the red solid lines represent gate start time points, while the blue dotted lines represent corresponding gate end time points in the same sequence from left to right. (c–f) are shown in the same spatial order as the intensity image stacks representing them in Fig. 6. Also, in each of (c–f), gates 1–4 are shown in the upper-left, upper-right, lower-left, and lower-right panels, respectively. Scale bar: 10 μm. (Color online only.)

