Fig. 2.
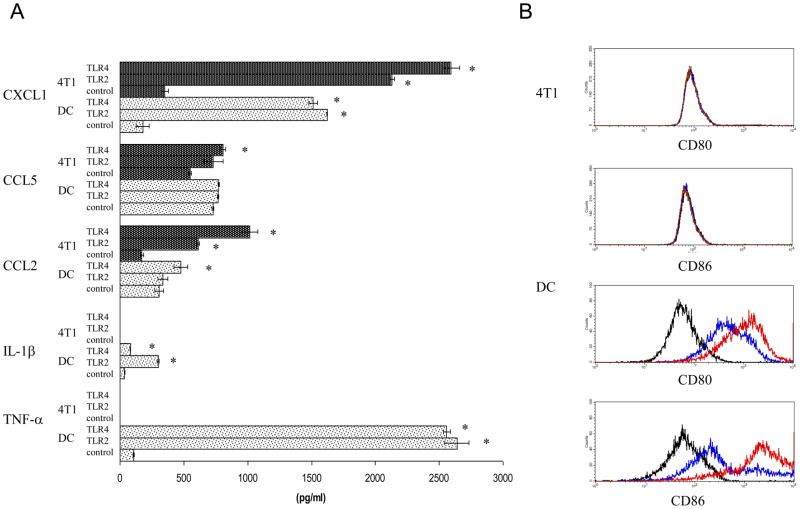
4T1 and CD11c+ DC are distinctly responsive to LPS. A. 4T1 and DC were treated with five μg/ml PGN (TLR2), ten ng/ml LPS (TLR4), or HBSS (control) for 24 hours. Supernatants were harvested and assayed for the indicated chemokines and cytokines by ELISA. The data are the average and standard error of three separate experiments. Where indicated (*) p< 0.05 using Student’s t-test relative to control. B. 4T1 and DC were treated with ten ng/ml LPS (red), or HBSS (blue) for 24 hours and then labeled for CD80 and CD86 expression. The isotype control is shown in black. The histograms are representative of three separate experiments.

