
Figure 5.
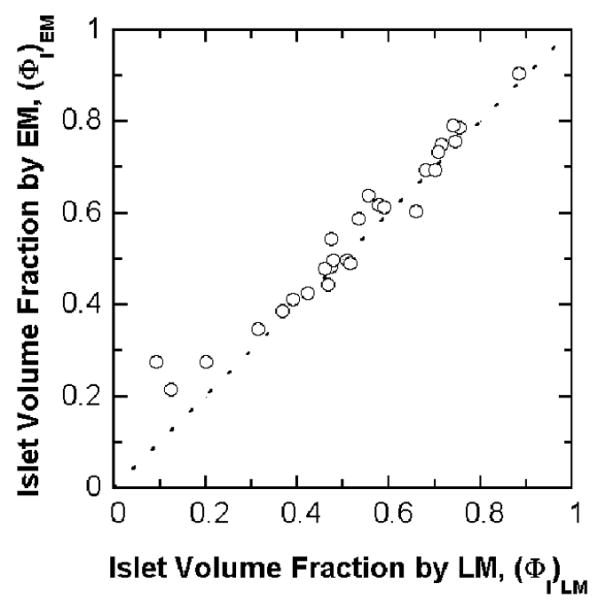
Calculated islet volume fraction by EM is plotted against the measured islet volume fractions by LM for 27 freshly isolated clinical preparations. The dashed line is the line of identity. The calculated islet volume fraction by EM correlates linearly with that measured by LM. Linear regression of the data gives a correlation coefficient R2 = 0.95 for all data and R2 = 0.97 without three data points for (ΦI)LM less than 0.3.