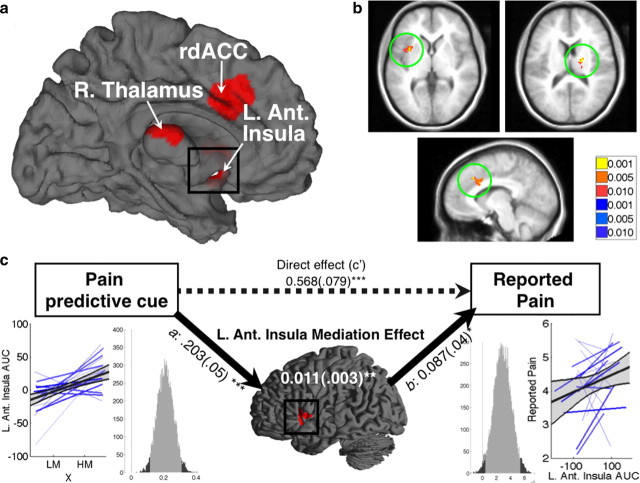
Figure 5.
Pain processing network mediators. a, Pain processing network mediators: surface map. Three key PPN regions were found to mediate expectancy effects on perceived pain. R. Thalamus, Right thalamus; L. Ant. Insula, left anterior insula. b, Pain processing network mediators. Slice views of PPNMs, clockwise from top left: left anterior insula (−36, 6, −4); right thalamus (18, −18, 14); left rdACC (−8, 18, 32). c, Mediation path diagram for the left anterior insula. Left anterior insula shows a positive path a effect, indicating more activity with high-pain cues. The mean standardized path coefficient is shown with standard error (in parentheses). Lower left, Individual subjects' regression lines and group average, as in Fig. 4. Lower right, Histogram of the bootstrap estimates of the path a distribution. The light shading shows the 95% bootstrap confidence intervals, and vertical line marks the null hypothesis value of zero. The right panels show the path b effect, which shows a link with trial-by-trial reported pain. Standardized path coefficients and standard error for the mediation effect are shown in white text on the brain surface map. The dashed arrow represents the direct effect of predictive cues on perceived pain (path c′). *p < 0.05, **p < 0.01, ***p < 0.001.

