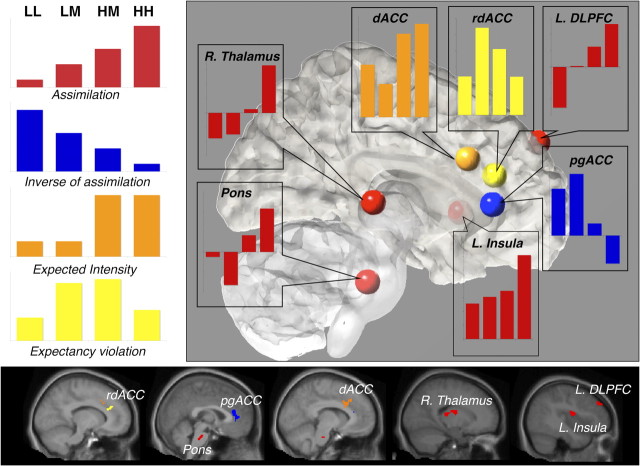
Figure 6.
Functional response profiles in key mediator regions. Bar graphs depict functional patterns underlying observed cue effects in key mediator regions. The left panel illustrates theoretical patterns across levels of noxious stimulation. Regions depicted in red, including left anterior insula (L. Insula), right thalamus (R. Thalamus), left dorsolateral prefrontal cortex (L. DLPFC), and pons display a pain assimilation profile (LL < LM < HM < HH). Conversely, pregenual anterior cingulate, depicted in blue, shows a response profile that is inversely related to the assimilation pattern (LL > LM > HM > HH). Dorsal anterior cingulate cortex, depicted in orange, shows a profile based on expected intensity, such that responses to the high-pain cue conditions (HH and HM) are greater than responses to the low-pain cue conditions (LL and LM). Rostrodorsal anterior cingulate, depicted in yellow, shows an expectancy violation signal, such that responses to medium trials are greater than responses to either of the validly cued conditions.

