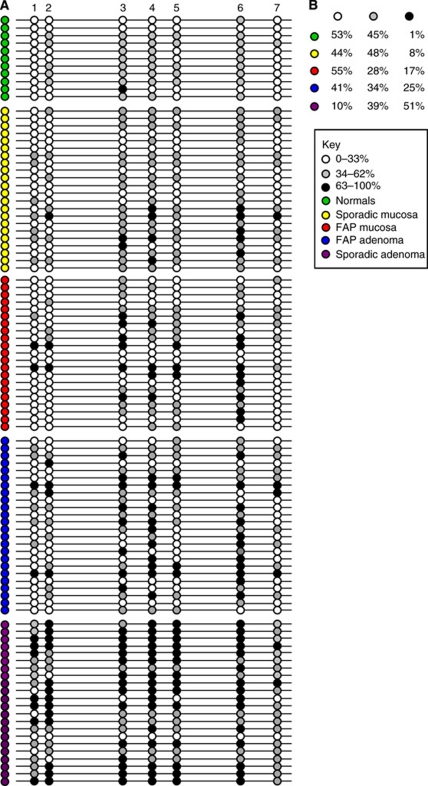
Figure 1.
Bisulphite-pyrosequencing analysis of sFRP1 gene methylation. (A) Pictorial representation of the percentage methylation of seven CpG sites within the first exon of the sFRP1 gene. The average methylation in normal tissue was calculated as 33%, CpG sites with less than 33% methylation are shown as white circles. Fully methylated (above the cut-off) samples corresponded to average methylation in normal tissue + 2 times the standard deviation (s.d.) as described previously (Chung et al, 2008), these are shown as black circles (>63% methylation). Grey circles represent 34–62% methylation. Five sample groups are represented (normal unaffected samples (green), FAP normal mucosa (red), sporadic normal mucosa (yellow), FAP adenomas (blue) and sporadic adenomas (purple)). The FAP normal tissue shows an increase in methylation (more black circles) compared with unaffected and sporadic normal tissue. Both FAP and sporadic adenomas had increased methylation compared with the normal samples. (B) The table summarises the data in panel A as the percentage number of samples within each group with methylation 0–33% (white), 34–62% (grey) and >63% (black).

