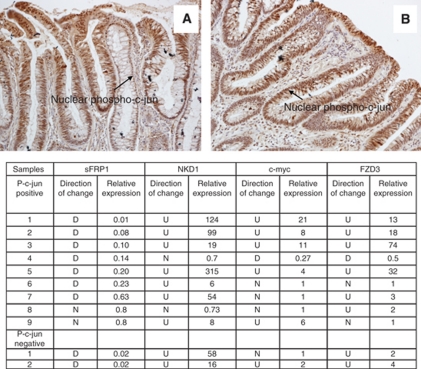
Figure 3.
Immunohistochemistry results for phospho-c-jun in FAP adenoma sections. Panels A and B show the typical pattern of nuclear staining for phospho-c-jun in adenomas. The table summarises the mRNA expression data for each of the nuclear phospho-c-jun-positive and -negative samples (D, down-regulation; U, up-regulation; N, no change). The relative expression values are calculated by comparing gene expression in adenoma tissue with expression in matched normal mucosa.

