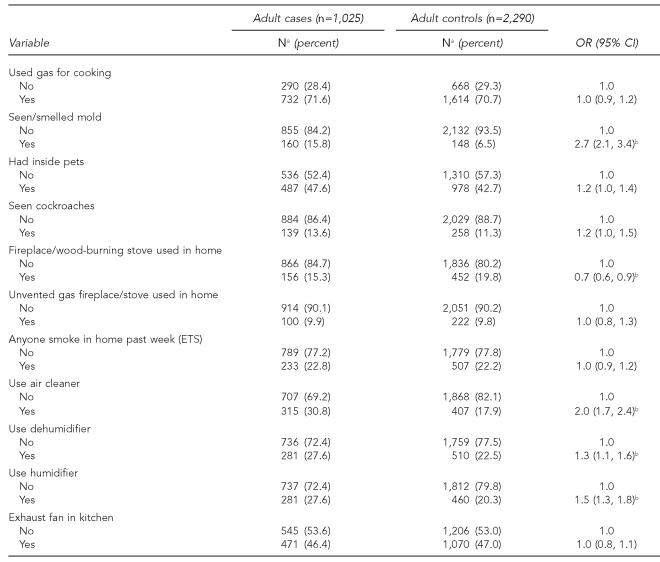
Table 3b.
Distribution of home environment exposures and unadjusted odds ratios in case vs. control adults (n=3,315), 2003 National Asthma Survey—New York State
aDue to missing values, numbers for some variables do not equal the total of cases and controls.
bStatistically significant
OR = odds ratio
CI = confidence interval
ETS = environmental tobacco smoke

