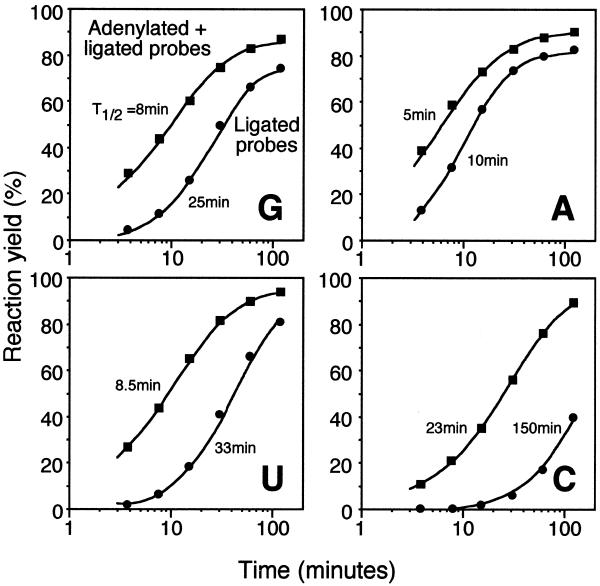
Figure 2.
Time-course of ligation of DNA probes, correctly base paired to four RNA targets, that differed in a single nucleotide position. Aliquots of the four different reactions, each including one of the four RNA targets and a matched probe pair, were withdrawn at different time points. The RNA target used in each experiment is identified by a capital letter in the lower right corner of the diagram. Squares represent formation of adenylated reaction intermediates deduced from the sum of adenylated and ligated probes, while circles represent ligated probes. The curves were obtained by iteratively fitting the functions Rad = Rmax × [1 – e–kad × t/(1 + 0.17 × kad × t)] and Rlig = Rad × Rmax × (1 – e–klig × t) to the data points in the adenylation and ligation time series, respectively. R is the reaction yield at time point t and k is the apparent initial rate of the reaction. The t1/2 estimates of the reactions in minutes are shown in the figure and were determined at the time points when R = Rmax/2.

