
Figure 5.
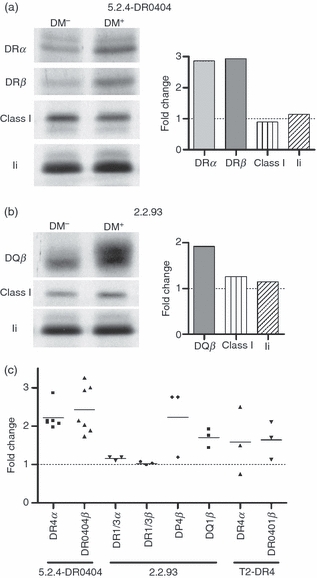
Increased abundance of selected class II alleles early after synthesis in the presence of DM. (a) 5.2.4-DR0404 and 5.2.4-DR0404-DM cells (107 cells per lane) were pulsed for 10 min with S35-Cys/Met and immediately collected for lysis (no chase). Individual chains were immunoprecipitated from denatured and pre-cleared NP-40 cell lysates and analysed by sodium dodecyl sulphate–polyacrylamide gel electrophoresis (SDS-PAGE): DRα (DA6.147), DRβ (XD5.a11), class I heavy chain (K455), and invariant chain (Ii) (Pin1.1). (b) 2.2.93 and 2.2.93-DM cells (107 cells per lane) were pulsed for 10 min with S35-Cys/Met and immediately collected for lysis. Native DR1/3 was cleared in three sequential immunoprecipitations with DA6.147 (not shown). Individual chains were then immunoprecipitated from denatured, pre-cleared lysates and analysed by SDS-PAGE: DP4β (DA6.231, repeated immunoprecipitations to clear all DP; not shown), DQ1β (XD5.a11), class I heavy chain (K455) and Ii (Pin1.1). Control immunoprecipitations from both cell line pairs under native conditions also showed no DM effect on class I (W6/32), Ii (Pin1.1) and calnexin (AF8) levels (not shown). Densitometry data are shown as fold change in band intensity for the DM+ sample compared with the DM− sample. Representative data from two experiments are shown. (c) Summary of fold change in class II band intensity in DM+ versus DM− cell lines from these experiments and from 0-hr time-points in similar experiments (e.g. Fig. 4b, and data not shown). All pulse times were 10–20 min, except for two experiments (35- and 45-min pulse for 5.2.4-DR0404 ± DM). All data represent immunoprecipitation of individual denatured class II chains except DR1/3 in 2.2.93.