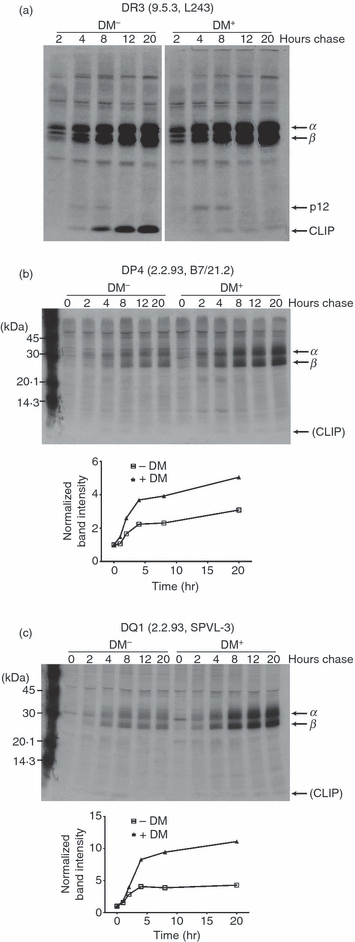
Figure 8.

DM effects on levels of class II with mature conformation. 9.5.3 and 9.5.3-DM (a) and 2.2.93 and 2.2.93-DM (b and c) cells were pulsed for 1 hr with S35-Cys/Met and chased for the indicated time periods. Aliquots of cell lysates, normalized for counts, were immunoprecipitated with L243 for DR3 (a, parts of the same gel), B7/21.2 for DP4 (b) and SPVL-3 for DQ1 (c) and then analysed by sodium dodecyl sulphate–polyacrylamide gel electrophoresis (SDS-PAGE). Graphs show densitometric analysis of band intensity at each time-point normalized to the time zero band. Representative images from one of two to three experiments with similar results are shown. Similar results were obtained for DP4 immunoprecipitated from 9.5.3-DM compared with 9.5.3 (similar to b; not shown), and for DR1/3 immunoprecipitated from 2.2.93 compared with 2.2.93-DM (similar to a; not shown).
