Figure 6.

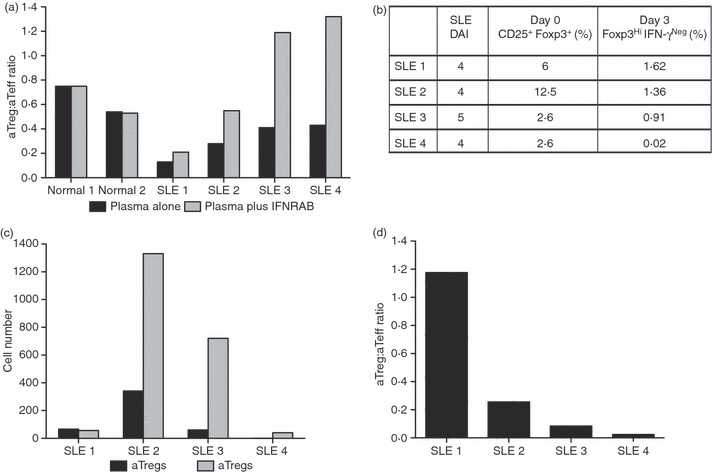
The aTreg:aTeff ratio is altered by the IFN-I environment in SLE. (a) Prior to anti-CD3 activation, PBMC from a healthy donor were incubated overnight with plasma from four patients with SLE with moderate disease activity [SLEDAI shown in (b)] or from two healthy donors, in the absence or presence of IFNRAB. The expansion of Tregs versus Teffs was determined by FACS at day 3 post-anti-CD3 stimulation. The aTreg:aTeff ratio in the absence or presence of IFNRAB is shown in (a). (b–d) PBMCs from the same SLE donors shown in (a) were activated with anti-CD3 to determine Treg and Teff activation. The number of CD4+ CD25+ FoxP3+ cells in freshly isolated cells (day 0) and the expanded Tregs and Teffs at day 3 post-anti-CD3 activation were determined by FACS. The CD4+ CD25+ FoxP3+ starting Treg population and generated CD4+ FoxP3HiIFN-γNeg aTregs (day 0 and day 3, respectively) are expressed in (b) as a percentage of total CD4 T cells. The numbers of aTregs and aTeffs at day 3 post-activation are shown in (c), and the aTreg:aTeff ratio is shown in (d) for each of four SLE donors. aTeff, activated effector T cell; aTreg, activated regulatory T cell; FACS, fluorescence-activated cell sorting; IFN-I, interferon-I; PBMC, peripheral blood mononuclear cells; SLE, systemic lupus erythematosus.
