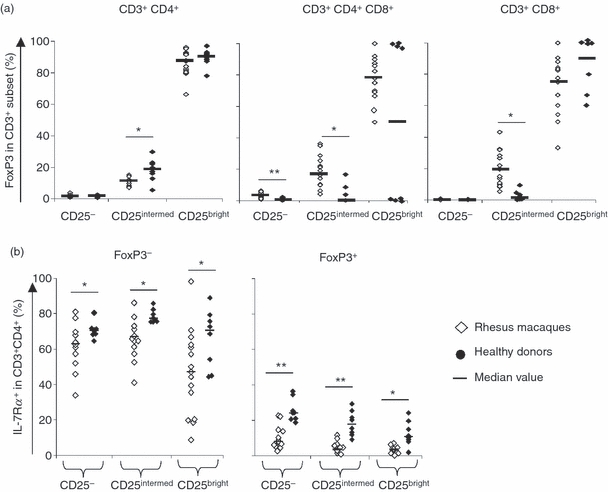
Figure 6.

Determination of regulatory T cells based on marker analysis. (a) CD4+ CD8– (left), CD4+ CD8+ (middle panel) and CD8+ CD4− (right) T cells were segregated based on CD25 expression and FoxP3 analysis was performed as shown in the supplementary Fig. S2. Note that some CD8+ (CD4−) CD25bright T-cells showed low FoxP3 expression in non-human primates. (b) Interleukin-7 receptor α (IL-7Rα) -expressing T cells in CD4+ CD8− regulatory T cells (Tregs) based on FoxP3 analysis. Higher percentage of IL-7Rα+ T cells in Foxp3− CD25bright Tregs in peripheral blood mononuclear cells from humans than in those from non-human primates. **P <0·001, *P <0·05 (Mann–Whitney U-test).
