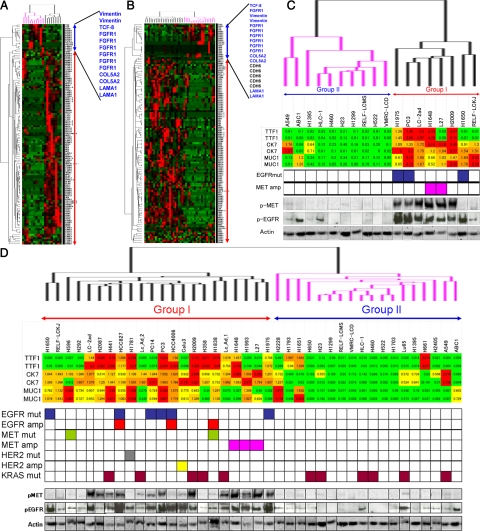
Figure 3.
A: Hierarchical cluster analysis of the initial 18 lung cancer cell lines using the genes selectively expressed in the bronchial epithelial phenotype and nonbronchial epithelial phenotype cell lines. The blue bar indicates genes selectively expressed in nonbronchial epithelial phenotype, and the red bar indicates genes selectively expressed in bronchial epithelial phenotype. B: Hierarchical cluster analysis of the entire panel of 40 cancer cell lines using the genes selectively expressed in the bronchial epithelial phenotype and nonbronchial epithelial phenotype cell lines. C: Enlarged view of the array; dendrogram shown in panel A along with sample identification (upper panel). Under the array dendrogram, TTF-1, CK7, and MUC-1 expressions, the status of EGFR and MET and the activation profiles of EGFR and MET of the 18 cell lines are shown. D: Enlarged view of the array dendrogram shown in panel B along with sample identification (upper panel). Under the array dendrogram, TTF-1, CK7, and MUC-1 expressions, the status of EGFR, MET, HER2, and KRAS, and the activation profiles of EGFR and MET of the 40 cell lines are shown.

