Figure 2.
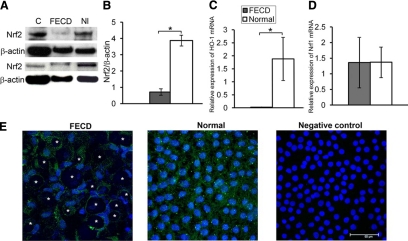
Decreased Nrf2 protein levels in FECD compared with normal endothelium. A: Western blot analysis of Nrf2 production in FECD and normal (Nl) corneal endothelial samples. Mouse kidney extract was used as a positive control (C). Bands were detected at the appropriate molecular weight of 57 kDa. β-actin was used for normalization of protein loading. B: Densitometric analysis of Nrf2 expression in CE. Data are means ± SEM of six FECD and six normal samples. Nrf2 protein levels were significantly decreased in FECD CE compared with normal controls; *P = 0.03. C: Real-time PCR analysis showed a decrease in HO-1 expression in FECD compared with normal. Results were expressed as fold-changes and normalized to B2M mRNA expression from five FECD and normal samples. *P = 0.04. D: Real-time PCR analysis did not detect a difference in Nrf1 expression between five FECD and five normal endothelial samples. E: Confocal images of corneal endothelium from FECD and normal patients were taken after immunolocalization of Nrf2 (green). TOPRO-3 was used for nuclei staining (blue). Negative control was incubated with secondary antibody only. Original magnification, ×400 with 2 zoom. Asterisks indicate the characteristic guttae of FECD CE; multiple guttae shown in the image.

