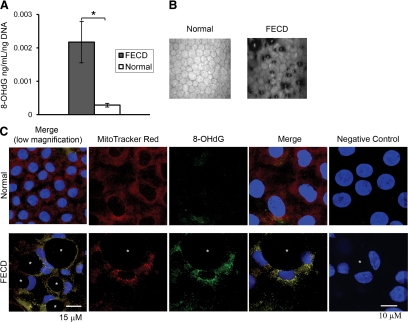
Figure 3.
Increased oxidative DNA damage in FECD compared with normal CE and its colocalization with mitochondria. A: High-sensitivity ELISA was used to detect average concentration of 8-OHdG, an oxidative DNA damage marker, per nanogram DNA from patients with FECD and normal subjects. Data are means ± SEM of five FECD and five normal samples. The level of 8-OHdG in FECD CE was statistically significantly higher than in normal CE; *P = 0.006. B: In vivo confocal microscopy photographs of corneal endothelium from normal controls and patients with FECD. In FECD, the dark areas represent corneal guttae. C: Confocal images of normal (top row) and FECD CE (bottom row) in whole mounts of corneal tissue with endothelium side up. Representative images were taken after staining of mitochondria with MitoTracker Red, a mitochondrion-specific stain (red; first column), and immunolocalization of 8-OHdG (green; second column). Images of negative controls incubated with only secondary antibody are shown in the right column. TOPRO-3 was used for nuclei staining (blue). Overlay of the three channels shows colocalization of MitoTracker and 8-OHdG (fourth column) in FECD. Asterisks indicate the characteristic guttae of FECD CE. Original magnification, ×400 with 5 zoom (first column) and 8 zoom.

