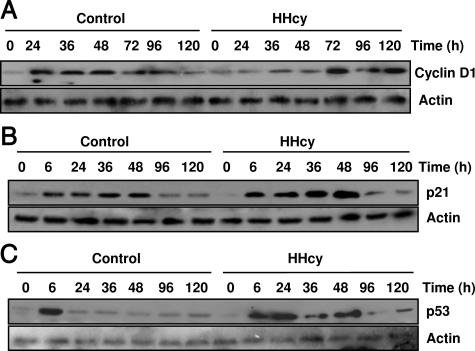
Figure 5.
Western blot analysis of cyclin D1, p53, and p21Cip1 in livers of normal and HHcy mice. Mice were sacrificed at various times after PH. Liver removed at the time of PH was used as the baseline (zero time). Cyclin D1 (A), p53 (B), and p21Cip1 (C) were measured using Western blotting analysis (n = 5 per group at each time point). Representative Western blots are shown.

