Figure 2.
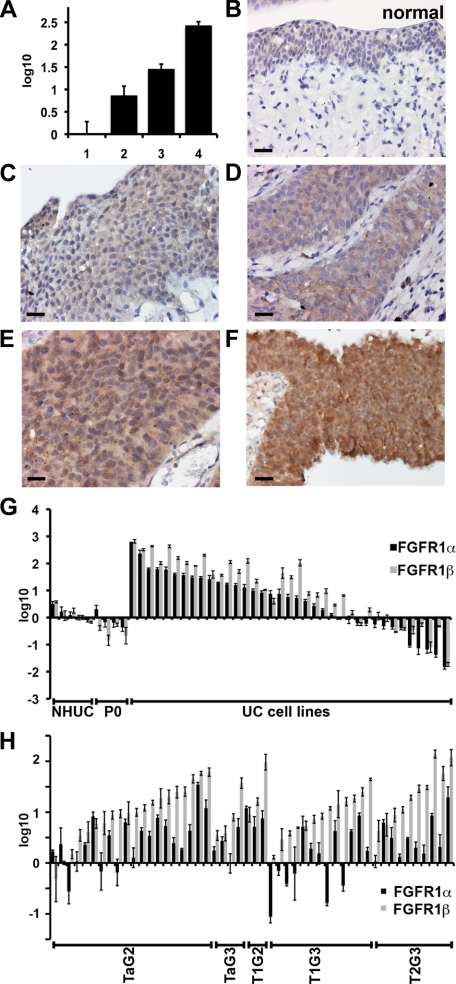
Expression levels of FGFR1α and FGFR1β in bladder cancer cell lines and tumors. A: Total FGFR1 levels were measured in four tumor samples by real-time RT-PCR (1, pTa grade 2; 2, pT1 grade 3; 3, pT2 grade 3; and 4 pT1 grade 3). Expression levels were normalized to normal bladder urothelium and are represented as log10. C–F: The same tumor samples were stained for FGFR1 by immunohistochemistry and compared to normal urothelium (B). Size bar is 20 μm; magnification, ×40. G: Expression of FGFR1α and FGFR1β in bladder cancer cell lines. H: Expression of FGFR1α and FGFR1β in tumor samples.

