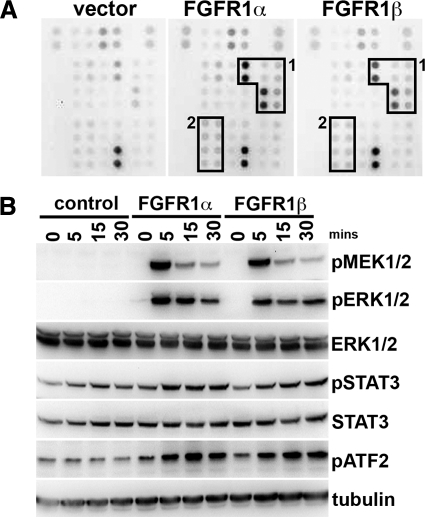
Figure 3.
Signaling downstream of FGFR1α and FGFR1β. A: Human phospho-kinase array analysis to examine differences between FGFR1α and FGFR1β signaling. Boxes 1 and 2 represent activated proteins from the MAPK- and STAT-induced signaling cascades, respectively. B: Confirmation by Western blotting of phosphorylation of proteins identified in the array analysis. Samples were taken over a time course of FGF2 treatment from TERT-NHUC cells expressing FGFR1α FGFR1β and controls.

