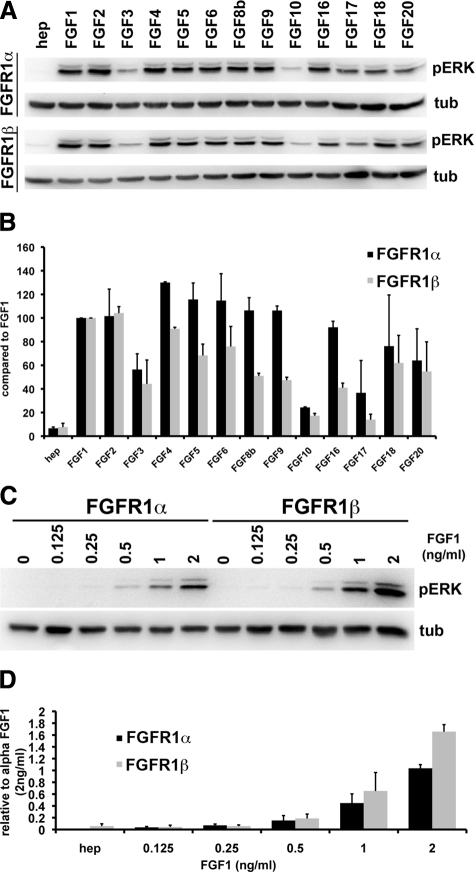
Figure 5.
FGFR1β is activated more than FGFR1α at lower concentrations of FGF1. A: TERT-NHUC expressing FGFR1α or FGFRβ were cultured with heparin and 100 ng/ml FGF for 5 minutes. Western blots were performed for pERK, stripped, and reprobed for tubulin. B: Levels of pERK were normalized to tubulin and quantified with Quantity One Software (BioRad). C: FGFR1α and FGFR1β were cultured with 0, 0.125, 0.25, 0.5, 1, and 2 ng/ml FGF1, and lysates were probed for pERK and tubulin. D: Quantitation of pERK levels normalized to tubulin.

