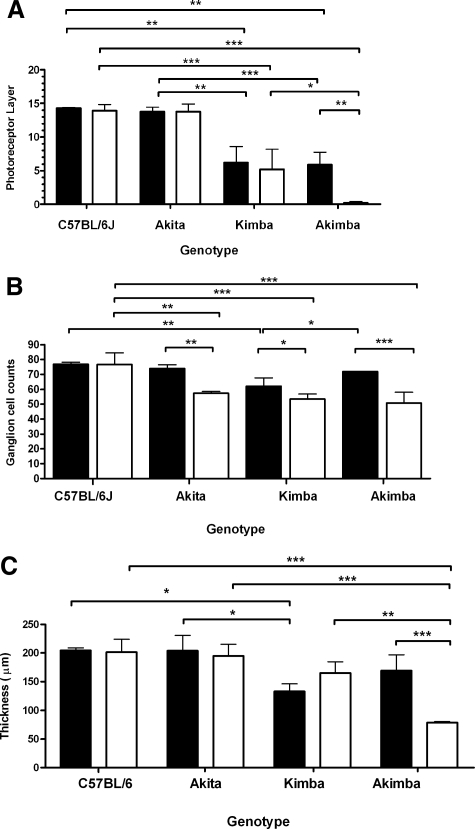
Figure 6.
Graph showing mean photoreceptor layer thickness (A), mean number of ganglion cells over a 170-μm linear distance (B), and mean neural retina thickness (C) of young and old C57Bl/6, Kimba, Akimba, and Akita mice. Black bars = young animals; white bars = old animals. *P < 0.05; **P < 0.01; ***P < 0.001.

