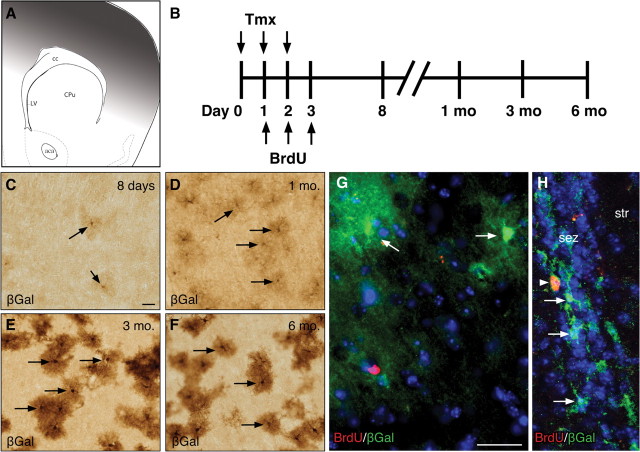
Figure 2.
Gli1-expressing cells in the cortex are a stable population. A, Schematic depicting the approximate A/P level of pictures shown in C–F. Sections up to 960 μm posterior to level shown were examined. Shaded area indicates cortical region from which cells were analyzed. B, Schematic of experimental protocol for tamoxifen and BrdU administration to adult Gli1CreER/+;R26lacZ animals. C–F, Bright-field immunohistochemistry for βGal in the cortex of Gli1CreER/+;R26lacZ animals given tamoxifen, and examined on day 8 (C), 1 month (D), 3 months (E), and 6 months (F) after tamoxifen. G, H, Double-labeling immunohistochemistry for BrdU (red) and βGal (green) in the cortex (G) and SEZ (H) of an adult Gli1CreER/+;R26lacZ animal at 3 months after tamoxifen. All sections were counterstained with DAPI (blue). Some βGal cells in the SEZ, but not in the cortex, colabel with BrdU (yellow, arrowhead). Arrows indicate single-labeled βGal cells. Scale bars, 25 μm.

