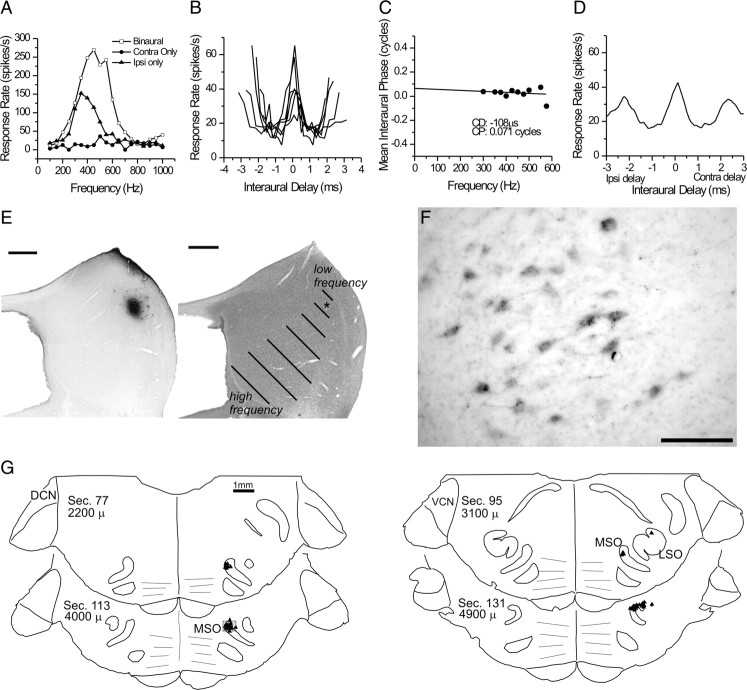
Figure 4.
Data for case 151. A–D. Multiunit responses recorded at the injection site. A, Frequency tuning for stimuli at 80 dB. B, ITD tuning curves obtained with a 1 Hz binaural beat stimulus with the “beat” on the carrier frequency. Tested frequencies were between 300 and 550 Hz, in 50 Hz steps. C, Phase versus frequency plot. D, Composite ITD tuning curve. E, Injection at the ICC recording site in and nearby Nissl-stained section (right). The asterisk indicates the position of the injection site center; black lines indicate the orientation and progression of frequency band lamina in the ICC. F, Photomicrograph (immunohistochemical staining) of retrogradely labeled neuronal somata in the dorsal MSO. G, Plots of retrogradely labeled neurons in representative sections. The box in section (Sec.) 113 corresponds to the area shown in F. Scale bars: E, G, 1 mm; F, 20 μm.

