
Figure 5.
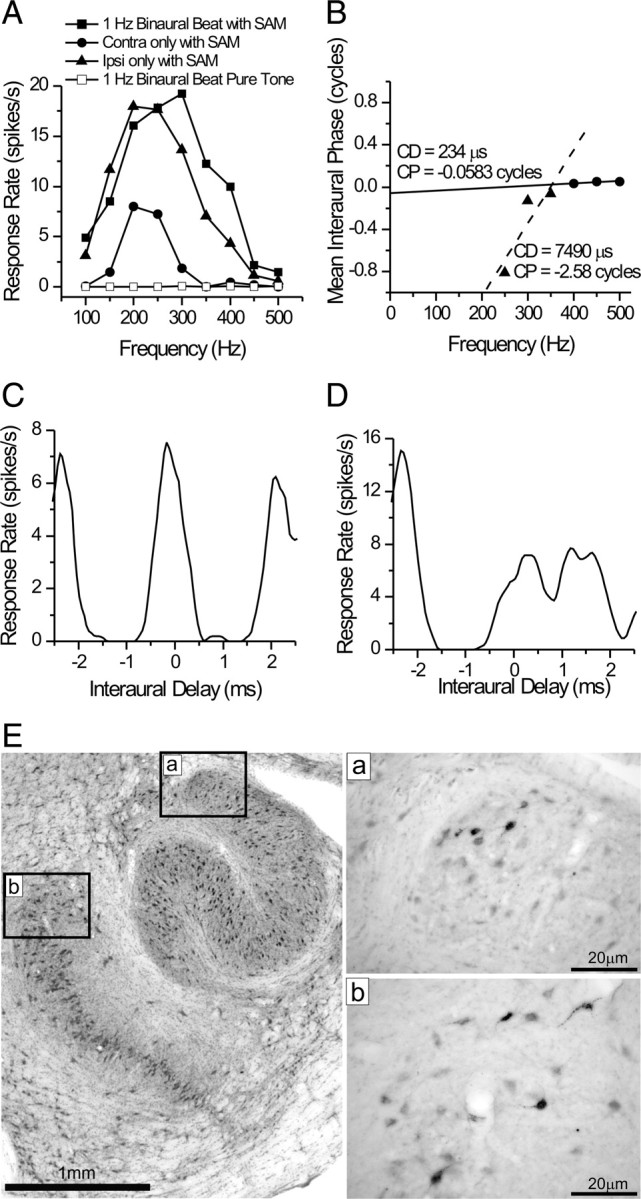
Data for case 24. A, Frequency tuning of a multiunit recording at the ICC injection site. B–D, Response data of a well isolated single unit at the same site. Data were collected with a 1 Hz binaural beat with an identical 23 Hz SAM added to the stimulus in both ears. B, Phase versus frequency plot. Delay tuning was heterogeneous across frequency. The unit had a definite peak-type response for frequencies between 400 and 500 Hz (circles, solid line). Delay tuning deviated from this dramatically at lower frequencies (≤350 Hz, triangles, dashed line) with trough-like characteristics C, D, Composite delay curves, one for each frequency range, are shown in C (≥400 Hz) and D (≤350 Hz). E, Nissl-stained section (left) and immunohistochemical photomicrographs (right) through the superior olivary complex ipsilateral to the injected ICC. Boxes (a and b) on the Nissl section indicate the cytoarchitectonic location of FG-labeled neuronal somata in the dorsolateral LSO (a) and the dorsal MSO (b) from adjacent immunoreacted sections.