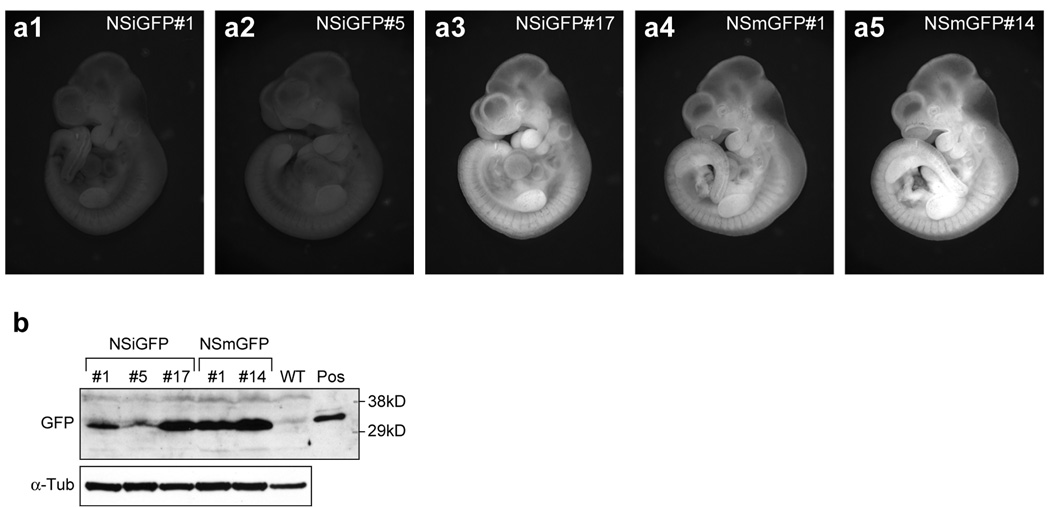
Figure 3. The GFP signal is weaker in the NSiGFP embryos than in the NSmGFP embryos on a per transgene copy basis.
(a) Direct visualization of the GFP signal in the NSiGFP#1 (a1), NSiGFP#5 (a2), NSiGFP#17 (a3), NSmGFP#1 (a4), and NSmGFP#14 embryos (a5) at embryonic day 10.5. Images were captured using the same parameters (see Methods). (b) GFP protein expression levels in the E10.5 embryos of the five transgenic lines were measured by western blots using anti-GFP antibody (Molecular Probe). The GFP expression levels (arrow) in the NSmGFP embryos (one-copy) resemble that in the NSiGFP#17 embryo (4-copy). Anti-α-tubulin (α-Tub) immunoblot was used as a loading reference. WT, wild-type; Pos, GFP expression plasmid-transfected HEK-293 cell lysate as a positive control.

