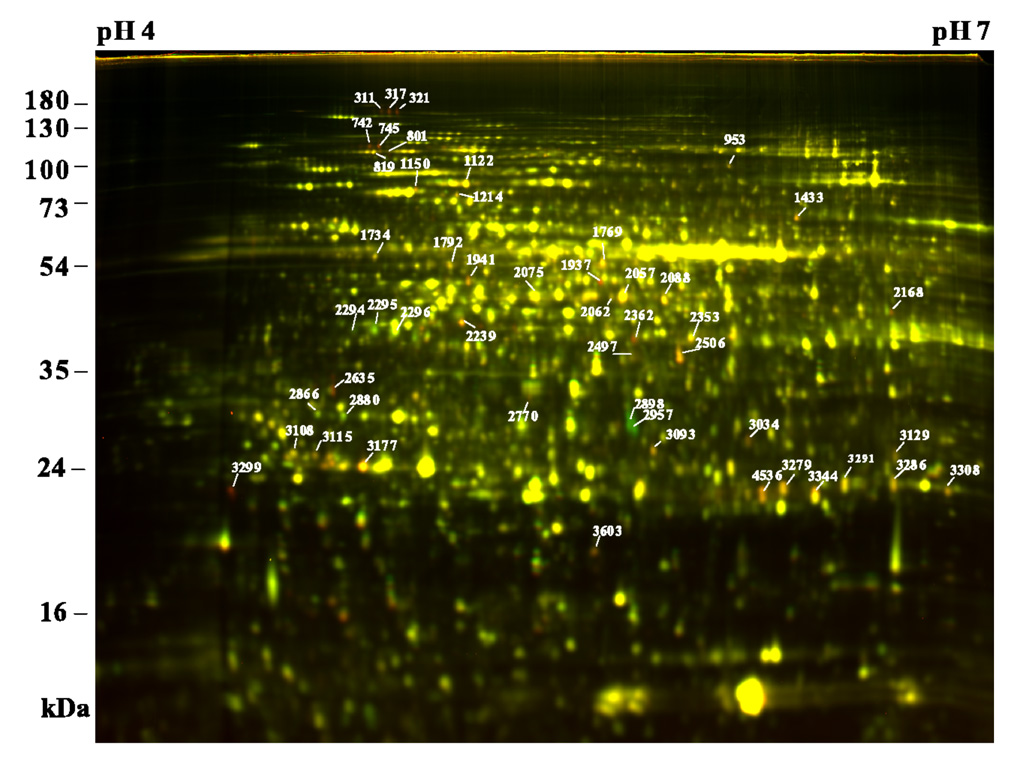
Figure 2. 2-D DIGE analysis of BR-regulated proteins.
Proteins of det2 seedlings treated with 100 nM BL for 24 hr (Cy5, red) were compared with those of mock treated samples (Cy3, green) by 2-D DIGE using 24 cm pH 4–7 IPG strips and 12.5% SDS-PAGE gel. Proteins increased by BL appear red, and those repressed by BR appear green, while those unaffected show yellow. Protein spots of interest are marked with spot numbers and their identities are shown on Table 1.

