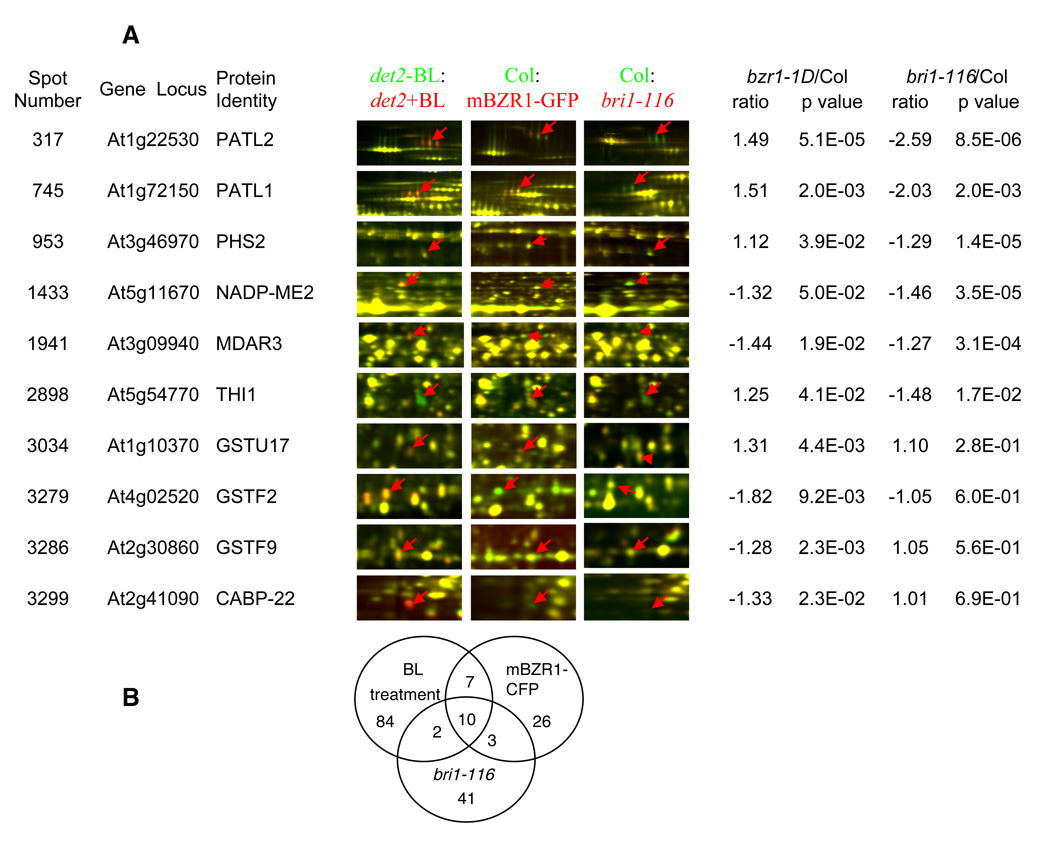
Figure 3. Proteomic changes in the bri1-116 or bzr1-1D mutant.
(A) Representative proteins regulated by both BL treatment and bri1-116 or bzr1-1D mutations. Protein samples from bri1-116 or a transgenic line expressing mBZR1-CFP (bzr1-1D) (Cy5 labeled, red) were compared with wild type samples (Cy3, green) by 2-D DIGE. The representative images showing the affected spots and the relative ratios of protein abundance are listed. In the superimposed 2-D DIGE images, protein spots up regulated by BL, bri1-116, or bzr1-1D appear red, those down regulated appear green, and those unaffected are yellow. (B) Venn diagram of protein spots regulated by BL treatment, the bri1-116 mutation, or bzr1-1D mutation.

