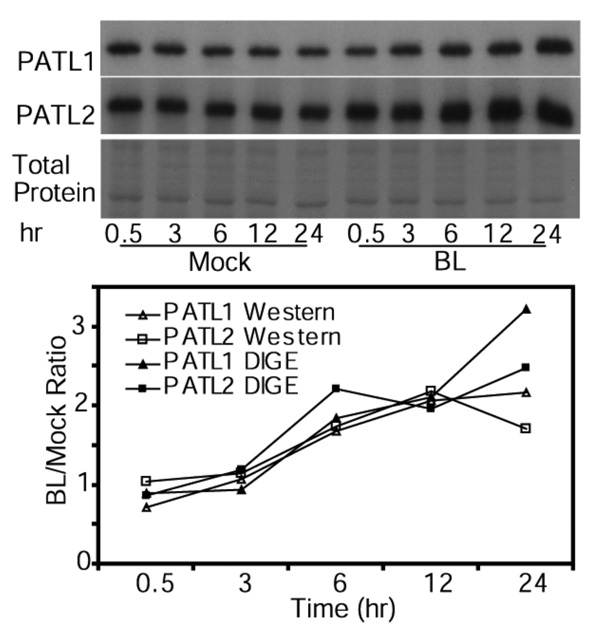
Figure 4. Immunoblot analysis of PATL1 and PATL2 expression in response to BL treatment.
Immunoblot of mock- and BR-treated samples was probed first with anti-PATL1 antibody, striped, and then probed with anti-PATL2 antibody. A duplicate SDS-PAGE gel stained by Commassie blue R-250 is shown. The graph shows the PATL1 and PATL2 protein levels quantified using either immunoblots or 2-D DIGE. Immunoblot data were quantitated using ImageQuant 5.2 and 2-D DIGE data were quantitated using the DeCyder 6.5 software.

