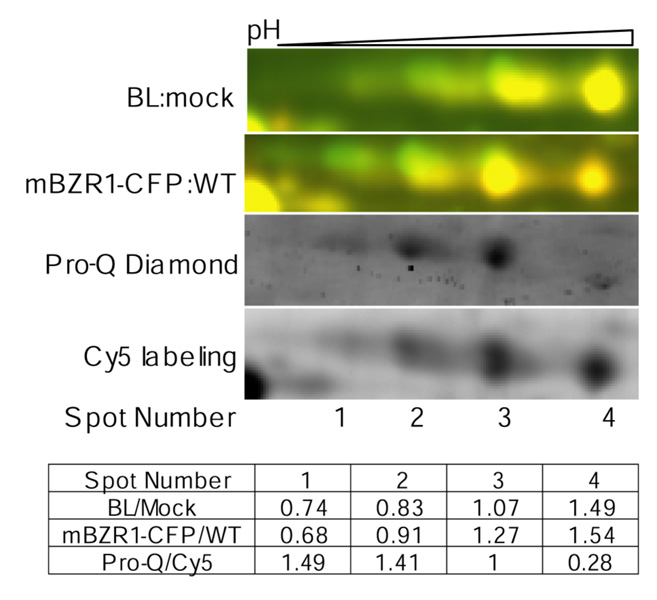
Figure 7. BR regulates BiP2 phosphorylation.
BR treatment and the bzr1-1D mutation affect phosphorylation of BiP2. From top panel to bottom in: Overlaid 2-D DIGE images of BR treated (Cy5, red) compared with untreated (Cy3, green) det2 samples, 2-D DIGE image of transgenic line expressing mBZR1-CFP (Cy5, red) compared with wild type (Cy3), and Pro-Q Diamond stain and Cy5 images from the same 2-DE gel, and the table showing the quantified data. A higher ratio of Pro-Q diamond to Cy5 signal indicates increased phosphorylation. The Pro-Q/Cy5 ratio was normalized to spot 3.

