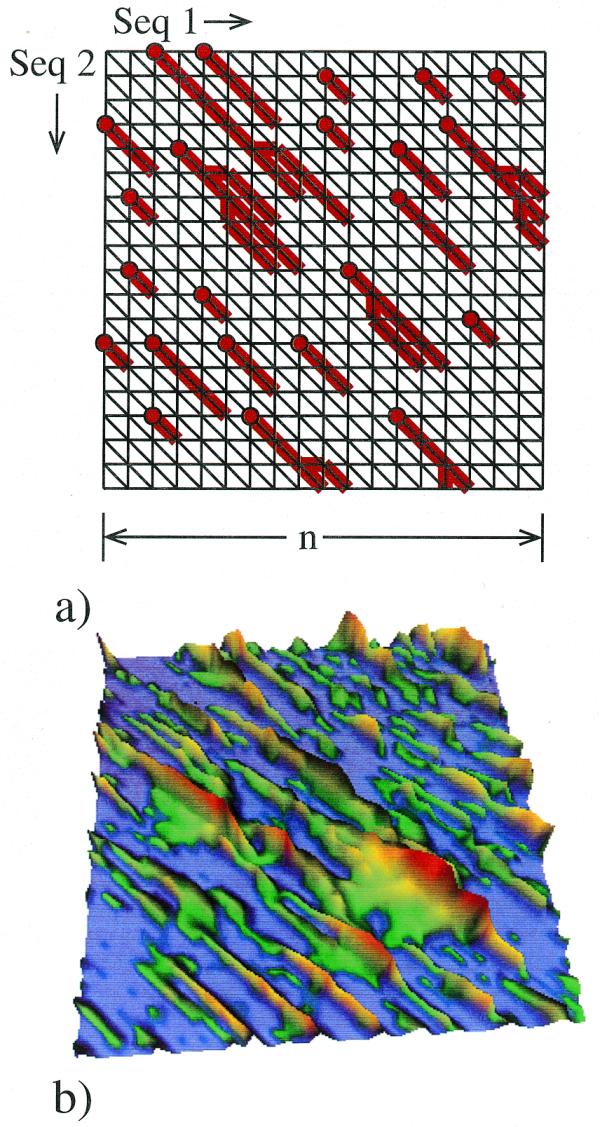
Figure 1.

Islands in a local alignment path graph. (a) Schematic representation of the path graph. In every cell C the red line recalls the choice made by the optimization procedure of the Smith–Waterman algorithm. By these lines, all the cells with non-zero scores are partitioned into islands according to which anchoring points (circles) they are connected to. (b) Score landscape on a 50 × 50 path graph. The score at every cell of the path graph is represented by its height above the surface and color-coded with zero scores corresponding to blue areas and increasingly red colors for higher scores. The example shown is generated with a BLOSUM-62 scoring matrix, and a score –(11 + k) for each gap of length k. The islands are easily seen.
