An official website of the United States government
Here's how you know
Official websites use .gov
A
.gov website belongs to an official
government organization in the United States.
Secure .gov websites use HTTPS
A lock (
) or https:// means you've safely
connected to the .gov website. Share sensitive
information only on official, secure websites.

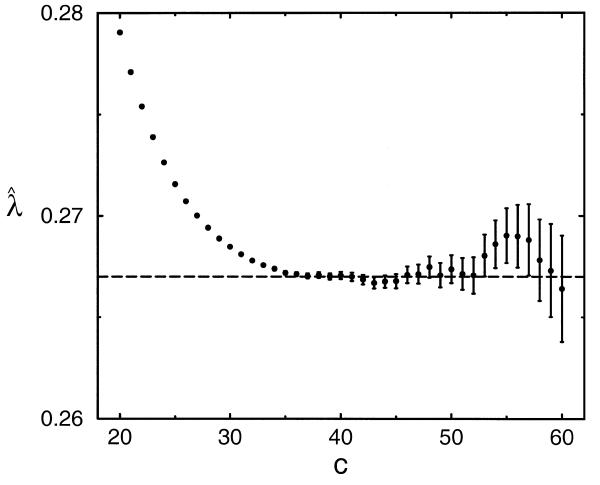
 obtained via the island method with different
cutoffs c. Standard errors for the estimates are
shown with error bars. The plotted horizontal line indicates the
best estimate of the asymptotic λ. Details
of the simulation are given in the legend to Table 1.