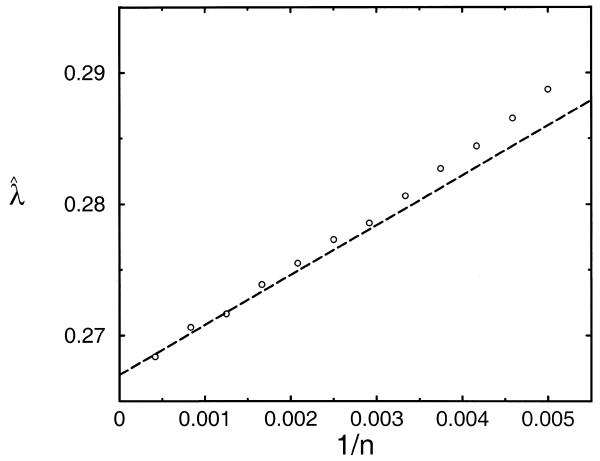
Figure 4.
Estimates  derived
from borderless n × n sequence comparisons by the island method as
a function of 1/n. Approximately 1 000
000 islands with a score of at least 37 were generated to produce
the estimates, which thus have a standard error of 0.1%;
the size of the symbols represents one standard error. The plotted
line represents the theory of equation 9 for the
apparent
  (n,n). The
scoring system and random sequence model are the same as those described
in the legend to Table 1.

