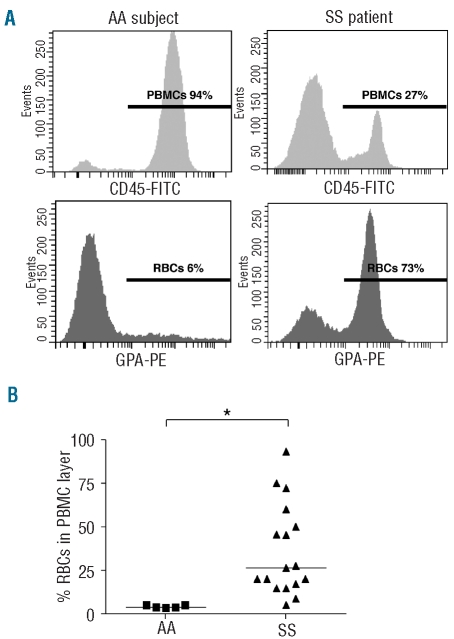
Figure 1.
Abnormal SS RBC co-selection during PBMC density gradient separation. (A) Typical histograms representing flow cytometry analysis of the PBMC layer in one AA subject (left panels) and one SS patient (right panels). Upper and lower panels represent CD45-FITC (PBMC) and GPA-PE (RBC) staining, respectively. The horizontal lines represent areas of positive events; percentages indicate the proportions of positive events for each marker. (B) RBC percentage in the PBMC layer in AA subjects (▪) (n=5) and SS patients (▴) (n=17). Horizontal lines indicate medians. The percentage of RBC in the PBMC layer is significantly higher in SS patients than in AA subjects. *P=0.0013, Mann-Whitney test.

