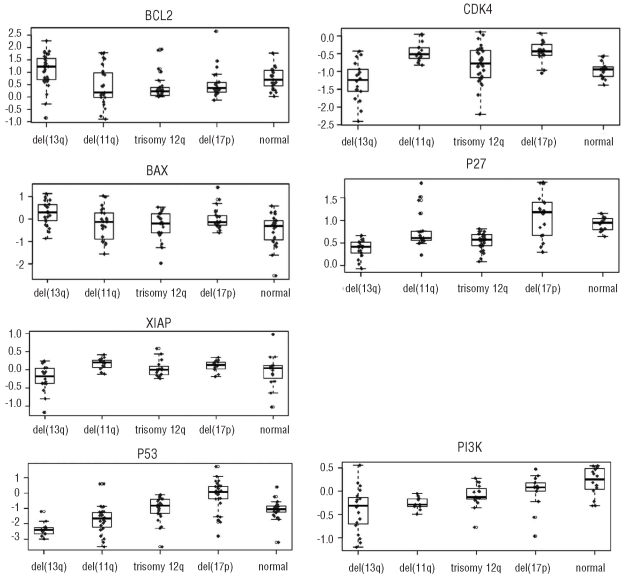
Figure 1.
Combined box plots/dot plots of differentially expressed proteins in CLL cases with del(13q), del(11q), trisomy 12q, del(17p) and a cytogenetically normal karyotype compared to all other hierarchical subgroups. Each dot represents the level of expression (y-axis) of a single CLL case. Negative values of expression are the result of log-transformation for statistical analysis.

