Figure 4.
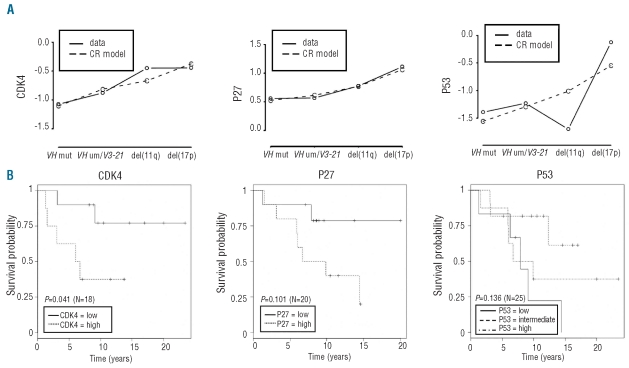
(A) Diagrams of ordinality risk for CDK4, P27 and P53. Protein expression was correlated to ordinal hierarchical risk as a surrogate marker for survival. Patients were stratified into four categories representing increasing risk [IGHV mutated < IGHV unmutated/V3–21 < del(11q) < del(17p)].(3, 26) Continuation ratio (CR) models for correlation of protein expression with hierarchical risk (univariate analysis) were calculated based on the data detected in this study and the assumption of a hierarchical risk as a surrogate marker for survival. Solid lines connect the observed mean log expression values per risk category, while dashed lines show the estimated lines according to the CR model without interaction effects. Diagrams show an increase of the risk category with increasing expression of CDK4, P27 and P53 [Wald-tests for overall effects at a significance level of 0.05; adjusted P values: CDK4: P<0.001 (n=90); P27 P<0.001 (n=98); P53: P<0.01 (n=117)]. (B) Kaplan-Meier curves for overall survival from diagnosis stratified by protein expression levels (high: log(expression) > median, low: log(expression) ≤ median). The given P values correspond to the log-rank tests between these groups (CDK4 (n=18), P27 (n=20), and P53 (n=25)). As the relation between death hazard and P53 protein expression level is highly non-linear three strata (with cut-offs at the 33%-quantile and 67%-quantile) were used for P53. The figure shows that survival rates are better for the intermediate group. This fits nicely with the observed non-linear effect of P53 on the hierarchical risk (Figure 4a), where the two high-risk groups del(11q) and del(17p) correspond to either very low P53 expression (11q) or very high P53 expression (17p), while the lower-risk groups showed intermediate P53 expression.

