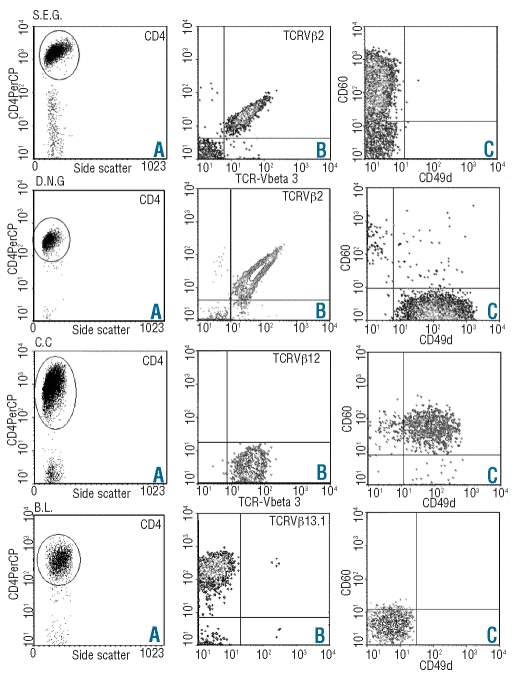
Figure 1.
Four representative samples from patients with different CD49d/CD60 phenotypes at the time of diagnosis. (A) Gating strategy of live lymphocytes expressing CD4 selection. (B) and (C) The three-color staining of the TCR-Vβ family expanded or the double-color stainig of CD60 and CD49d on electronically gated CD4+ T cells, respectively. In all cytograms, the lower-left quadrants delimit the fluorescence intensities obtained with appropriate isotype and fluorochrome-matched negative control antibodies. Quadrant gates in (C) are derived from appropriate fluorescence-minus-one controls.

