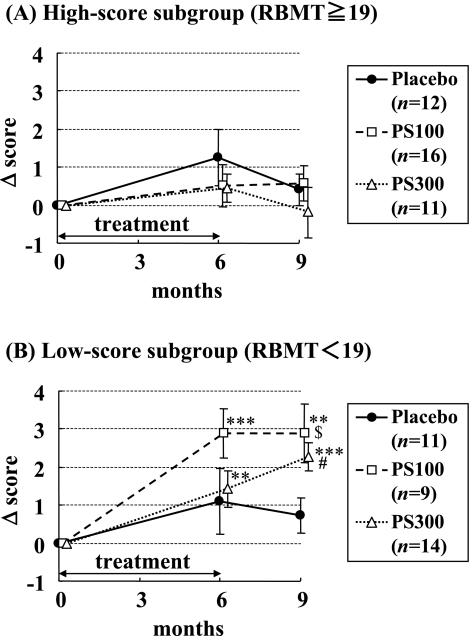
Fig. 2.
Effect of Soy-PS on HDS-R performance in high-score and low-score subgroups. Subjects were divided into two subgroups based on their baseline RBMT score. (A) High-score subgroup (RBMT score = 19 or more). (B) Low-score subgroup (RBMT score<19). Values are means ± SEM and shown as changes in score against the baseline. **p<0.01, ***p<0.001 vs baseline, $p<0.1, #p<0.05 vs placebo group (Steel’s multi-comparison test).

