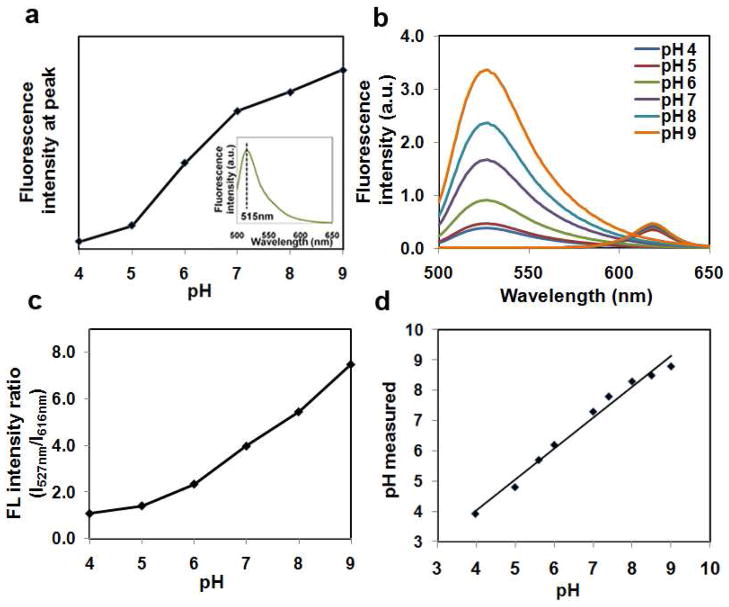
Figure 7.
pH sensing using QD-AMF dual-color sensor. (a) pH-dependent emission of AMF fluorescence measured at the peak (inset, a representative AMF spectrum). (b) Fluorescence emission of QD-AMF conjugates at various pH. The contributions from QD and AMF are separated from the composite emission spectra for accurate measurement of the peak intensities. While QD fluorescence remains constant, fluorescence from AMF fluctuates with pH. (c) Working curve for pH measurement produced with AMF/QD fluorescence intensity ratios (I527/I616) versus pH values. (d) Correlation of known pH values and those measured with the QD-AMF pH sensor using the working curve in (c).

