Figure 1.
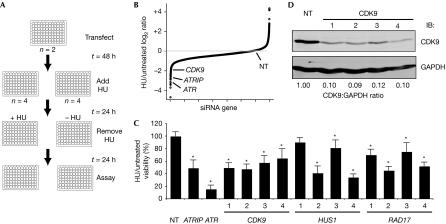
Silencing cyclin-dependent kinase 9 causes hydroxyurea hypersensitivity. (A) Diagram of primary screen assay as described in the text. (B) Summary of results of primary screen. The log2 ratio of treated compared with untreated cell viability relative to the nontargeting (NT) siRNA for each gene is shown. (C) Validation of CDK9, HUS1 and RAD17 after deconvolution of siRNA pools. Four siRNAs targeting each gene were tested as indicated. Treated compared with untreated percentage viability was calculated and the mean and s.d. values from three replica experiments are shown. Asterisk indicates P<0.05. (D) Western blot analysis demonstrating efficiency of knockdown with the indicated siRNAs. ATR, ataxia telangiectasia and Rad3-related protein; ATRIP, ATR-interacting protein; CDK9, cyclin-dependent kinase 9; HU, hydroxyurea; NT, nontargeting; siRNA, small interfering RNA.

