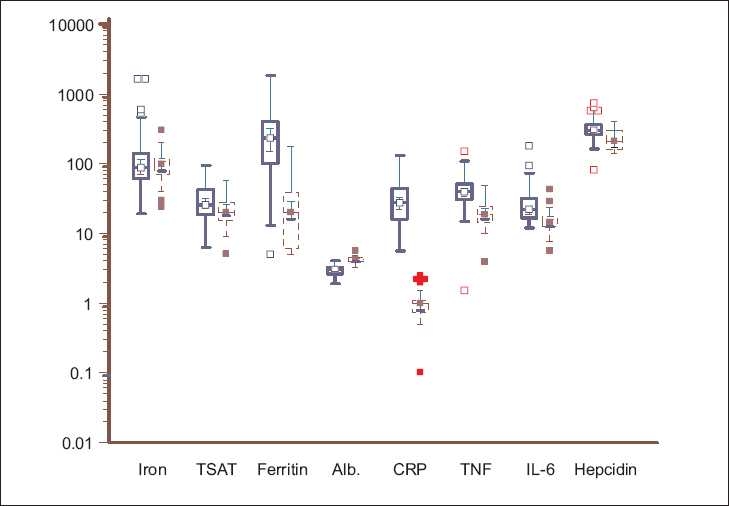
Figure 2.

Box-and-whisker plots showing the serum iron (microgm/dl), transferrin saturation (TSAT, %), ferritin (ng/ml), albumin (g/dl), C-reactive protein (mg/l), TNF-a (pg/ml) IL-6 (pg/ml), and hepcidin (ng/ml) in ESRD patients (solid blue line) and healthy controls (dashed red line). Log-transformed data, with the solid horizontal line denoting the median along with the interquartile range
