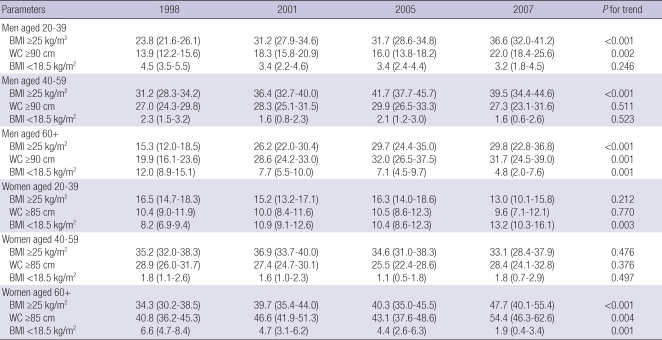
Table 4.
Age-specific trends in age-standardized prevalence (95% confidence intervals) of overweight (includes obesity) and underweight
Data were from 1998, 2001, 2005, and 2007 Korea National Health and Nutrition Examination Survey (K-NHANES) (10,043 men and 12,758 women aged 20+). BMI refers body mass index and WC refers waist circumference. The 2005 Korean Census population was used as the standard population and sample weights from the K-NHANES were considered in the direct standardization. Logistic regression analyses were employed to test time trends of the age-adjusted prevalences, after taking account of primary sampling units, stratification, and sample weights from the K-NHANES.

