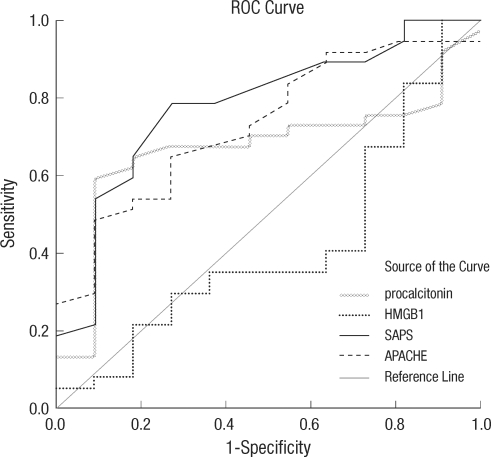
Fig. 1.
ROC curve for the prediction of infectious and non-infectious fever. HMGB1, high mobility group B 1; SAPS, simplified acute physiology score; APACHE, acute physiology and chronic health evaluation III. The area under the curve was 0.726 (95% CI; 0.587-0.865) for PCT, 0.759 (95% CI; 0.597-0.922) for the SAPS II score, and 0.715 (95% CI; 0.550-0.880) for the APACHE III score.

